Today I would like to befriend you with a very basic algorithm widely used in data mining and machine learning. It's K-Means, of course!
Think, that there is not too much of advanced math in computing it either! We basically just need to know what is Euclidean distance and how to properly filter the data.
You may be wondering now if I have seen the equation of K-Means and that it looks so difficult that you perhaps need some superpowers to gain an understanding of it. That's what I thought too, but apparently, it's much easier when you get rid of the formal description. I will not be trying to explain complicated maths and theories behind this algorithm (should I?). It will be more like introduction with some hands-on practice.
First of all, what is K-Means?
It is an algorithm that is often used in clustering. Clustering happens when we want to group observations in our dataset in distinctive groups to make the analysis easier. Let's use a simple example. Imagine that you have a set of jobs that you are considering to apply for. Each job that you found has certain descriptive features, as salary, amount of free days, how far it is from your apartment etc. Now, how do you pick the best offer? This is when K-means clustering comes in handy! Thanks to this algorithm, you can go over your feature space, compare feature vectors [salary, free days, km from home] between each other and group them according to these three labels. Although K-means clustering is considered to be a case of unsupervised learning, once you split your dataset to k groups, you will be able to give them particular labels according to their place in your n-dimensional space.
Okay, but how do we start?
Of course, you can skip the hard part for now and go and play with some examples provided by Python library called sklearn, but we'll start from scratch!
We are going to group Iris Species into three groups! Te dataset was taken from Kaggle, which is a great place for everyone interested in data science.
The dataset looks like this: it consists of 150 samples, 50 samples per each species. Each sample has the following features: sepal length in cm, sepal width in cm, petal length in cm, petal width in cm and a label (the real species). It means that each observation has 4 features (saved in a vector) and a label that right now will not be taken into account.
Before we start any computations, we need to get rid of the unnecessary information, such as columns descriptions and IDs.
The description tells us that we have got three different species, so if we want to group the samples it would make sense to group them in three clusters.
Let's implement our K-means clustering!
My algorithm is slightly simplified. In general, the initial k cluster centers should be generated randomly. In my code, I first randomly shuffle the dataset and then assign initial k cluster centers to the first k observations.
Below, there are steps to be followed while creating K-means clustering algorithm.
- Choose initial cluster centers.
- For each cluster center (which is a n-dimensional vector) calculate a Euclidean distance to all other points in the space. This means that we should calculate Euclidean distance between our cluster centers and all the flowers.
- In result, for each observation we obtain three results (one for each cluster center).We assign each observation to the cluster center that resulted in the lowest distance.
- Recompute cluster centers! Recomputing is done by getting the mean of points assigned to each cluster.
- Check whether recomputed cluster centers match the initial ones. If not, repeat steps 2,3 and 4 until they do match.
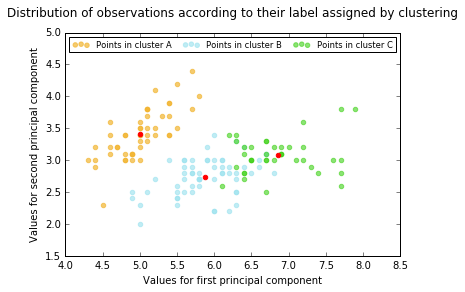
Below, you will find two visualizations of the data (available thanks to PCA). As you can see, some of the datapoints were not classified correctly, although the general pattern of assignment remains very similar.

As an algorithm, K means is really simple. What may be difficult is the theory and things that need to be considered while implementing the algorithm. Machine learning is not only about data, it is also about the knowledge and experience that is used to verify certain ideas of data analysis. I will try to cover some general thoughts about K means in the next entry. In the meanwhile, feel free to check out my code, experiment and post comments and thoughts. I will be happy to learn from you!
Fun fact: In order to speedup k-means you can use square Euclidean instead of regular one because you are using this distance only to find nearest one. And if x < y therefore x^2 < y^2 holds. So you can save one square root ;)
ReplyDelete